Showing posts with label NAO. Show all posts

Friday, April 3, 2026

2025/26 SNOWFALL - NORTH ADAMS, MA.

Currently, as of April 2, 2026, in North Adams, MA., (extreme northwestern Massachusetts) we have closed-out the 2025/26 season with a total of 87.3" (* our average season snowfall is 78.1"). +9.2" above normal snowfall for the 2025/26 season. Most snowfall this season, was recorded from a Miller Type-B coastal storm (Nor'easter) that produced around 20.0" in North Adams of dry, fluffy, powder snow, along with areas of blowing & drifting snow, following an Arctic blast January 25-26, 2026. The slightly above normal snowfall, was primarily due to a very stretched Polar Vortex (PV), as-a-result of an established -AO, -NAO, +PNA  from early January to mid February 2026. The upcoming 2026/27 winter season is a B-I-G ?... due to extended & long range computer forecast models supporting an El Niño, a natural climate pattern characterized by warmer-than-average sea surface temperatures in the equatorial Pacific! Forecaster: Daniel Viens (Dedicated To Understanding New England's Climate!)


Monday, November 27, 2023

A RECOMMENDATION TO THE HEARTY NEW ENGLANDERS


 For those hearty New Englanders, with a deep interest in extended and long-range outlooks, I strongly encourage you to listen to WeatherBELL's Joe Bastardi's Saturday Summary . Also, The Wise Guys of Weather | Sunday's at 5 P.M. | AM 970 The Answer. This forecaster HIGHLY recommends for anyone interested in extended & long range thoughts. Daniel Viens 


Sunday, October 8, 2023

HOPE & PRAYERS FOR GEORGE TROTTIER

 I post with a heavy ❤ that George Trottier, my best friend and incentive to the establishment of this New England themed weather (blog) website, has peacefully passed on October 8, 2023. I HOPE and pray he passed peacefully, to his eternal home. Love, Danny 

Saturday, February 4, 2023

MAINTAINING THE SITE


 Due to a MAJOR health related set-back personally, and the passing of my best friend, I am going to do my best to keep this established New England themed weather website online. I HOPE  to return  posting at-some-point on this blog, once I can truly focus on producing quality posts in my heart! Please access the links on this site and/or John Hockridge; New England Weather Associates (NEWA), which I feel is quality weather related information,  found on the websites linked. Thank you for understanding. Daniel Viens, establishing author of New England NAO.

Tuesday, November 24, 2020

SNOWFALL DATA TRENDS

Facebook timeline-post (2018)
Attached is Snowfall Data for North Adams, MA. Official records maintained by John Hockridge, Meteorologist / owner; New England Weather Associates. The data opens with the 1974/75 Winter season (NEWA was established in 1974), and what is clearly seen on the graph overall is that average annual snowfall has indeed been increasing in North Adams since the 1992/93 Winter season (Blizzard of '93). While there have been some winters with below to well below average snowfall in North Adams post 1992/93 season, the overall trend has favored slightly above normal annual snowfall (as seen on the graph). Forecaster: Daniel Viens, establishing author of New England NAO.

Sunday, November 22, 2020

CURRENT NAO & NE 2020

(Facebook timeline-post) 


Currently, what has nature taught us this year? Looking at the light red shaded chart, credit: NOAA's Climate Prediction Center (CPC), of the North Atlantic Oscillation (NAO) Monthly mean-average; reveals that the mildest weather conditions in New England, temperatures above to well above normal prevailed during January through March 2020, when the NAO was consistently positive or averaged a monthly mean above 1.00 (Standard Deviation), as indicated on-the-chart (black circles). Since April 2020, the NAO has undergone a complete reversal, that has promoted below to well below normal temperatures at-times. Most notably, the consistency of the NAO since the significant pattern reversal in April, will be a very important 'wild' card during the upcoming 2020/21 Winter Season. What is the NAO telling us? The support is overwhelming for New England to experience above to well above normal snowfall during the 2020/21 Winter Season due to overall 'negative' trends of the NAO since April... that strongly favor a colder / stormy weather pattern. The NAO is especially supported by the current state of the Sun; exiting-the-dead of a solar minimum! Forecaster: Daniel Viens, establishing author of New England NAO. (* NOTE: This is also 'consistent' with the NAO historically, as noted from my previous post on October 25, 2020.)

 A great question!: BOSTON had an all time record snowfall of 108.6" during the 2014/15 Winter Season. Average winter season snowfall in BOSTON is around 48.0"; and 2014/15 Winter Season... 60.6" above normal snowfall in BOSTON! Ironically, the North Atlantic Oscillation (NAO) wasn't in a noted 'negative' phase during *2014/15; which is usually a very important climate driver for New England to experience above to well above normal snowfall. *2014/15 was an extreme outlier due to strong High pressure ridge over western North America. When you state global warming... this research is out to make viewers aware, IF my overall thoughts are truly realized, that the climate is largely driven by natural & cyclical factors... starting with the Sun. The Sun is currently exiting-the-dead of a solar minimum which strongly favors the NAO to be observed in it's 'negative' phase during the 2020/21 Winter Season. Based on past analogs, 2010/11 & 2000/01, when the Sun was also exiting-the-dead of a solar minimum, BOSTON had around 30.0" above normal snowfall but the hills of western and parts of northern New England had around 50.0" to 60.0" above normal snowfall. Forecaster: Daniel Viens, establishing author of New England NAO. (Picture of Mt. Greylock War Memorial Tower taken by me in early December 2012, on a pre-winter hike to the summit.)


Sunday, October 25, 2020

HISTORIC NAO & NE 2020

(Facebook timeline-post)


This picture was taken by me May 9, 2020 at Whitcomb Hill Summit, Mohawk Trail - Route 2 Florida, MA., during an amplified winter-like weather pattern known as the negative phase of the North Atlantic Oscillation (NAO). This pattern prevailed for much of May 2020. The negative NAO is a high latitude block of atmospheric pressure that becomes established around southern Greenland in the North Atlantic; that blocks the jet-stream (upper-air flow) from moving straight west-to-east, sending air of polar origin into the eastern U.S. (northeastern U.S. / New England), along with increased potential of coastal storms... 'Nor'easters'. Historically, the average phase of the NAO during the month of May, is a direct correlation to the average phase of the NAO observed during the upcoming winter season. Forecaster: Daniel Viens, establishing author of New England NAO.

Friday, October 9, 2020

UNDERSTANDING OUR SUN


(Facebook timeline-post)
Look at the 📊 (graph of the Sun) where I marked '22', Solar Cycle 22 was the MOST active in-terms of overall sunspot activity since the 1950's (* likely a longer period-of-time / cycle than dating back to the 1950's). During the peak of Solar Cycle 22, 1988 - 1992, the term Nor'easter all but became extinct in New England. Now, let's look at what actually happened during the winters from 1988 - 1992 in North Adams, during the peak of the MOST active solar cycle (22) since the *1950's.

From 1988 - 1992 (* indicated by red circle on posted snowfall chart)... there were four (4) winters in-a-row with below normal snowfall in North Adams. With the exception of 1989/90; three (3) of these winters experienced well below normal snowfall. This period is the longest duration of back-to-back winters with below to well below normal snowfall since the *1950's. * Average winter season snowfall in North Adams, MA. is 78.1". * To be clear the average of those four (4) winters (1988 - 1992) combined is 44.8" snowfall, which is the lowest 4-year average snowfall in North Adams, at-least dating back to 1974.

 CONCLUSION: MUCH unlike the highly active Sun during the peak of Solar Cycle 22 from 1988 - 1992; Solar Cycle 23, and especially the current decaying Solar Cycle 24... has trended MUCH weaker. As-a-result, both the Winters of 2010/11 & 2000/01, that were exiting-the-dead of a solar minimum, were truly realized through stronger support for sustained high latitude atmospheric blocking. This allowed for well above normal snowfall in North Adams during 2010/11 & 2000/01. We are now exiting-the-dead of a solar minimum again, and as we exit the overall very weak, decaying Solar Cycle 24... nature is perfectly aligned to repeat it's course experienced 10 & 20-years-ago, with above to well above normal snowfall in New England, during the upcoming Winter Season 2020/21. Forecaster: Daniel Viens, establishing author of New England NAO.


Saturday, September 19, 2020

2020/21 WINTER SEASON

(Facebook timeline-post)


To think I am posting about another upcoming winter season, despite being terribly wrong during the 2019/20 Winter Season & especially the 2015/16 Winter Season. But I am NOT God and only do weather outlooks for the New England region as an intense hobby. Besides, each winter season further humbles me, especially during times of inaccuracies, and I continue to learn. We turn the page to the upcoming 2020/21 Winter Season! But what have I learned NOT to repeat the same inaccuracies? I have learned that the 'Sun' or 9-11 year sunspot cycle needs to be carefully weighted in-respect to where we currently are in-the-cycle. For example, the sunspot cycle holds most weight concerning long-range outlooks when the Sun is at-the-dead but especially exiting-the-dead of a solar minimum. The strongest signal following the solar cycle is when the Sun is exiting-the-dead of a solar minimum due to strong presentation of atmospheric high latitude blocking... like the upcoming 2020/21 Winter Season. The solar cycle averages out to be exactly 10.66 years. This means that the Winter Seasons of 2010/11 & 2000/01; were also exiting-the-dead of a solar minimum. The trend is very clear what happened 10-years & 20-years ago during the noted winters, following this averaged 10-year cycle. Both winters experienced snowfall well above normal in North Adams, 50"-60" above normal snowfall (average season snowfall in North Adams, MA. is 78.1"), along with slightly below normal temperatures. We reviewed 2000/01 & 2010/11... dating back to 1974, 2000/01 was the snowiest winter & 2010/11 was the third snowiest winter in North Adams. Now, the 10-year anniversary is approaching, and yes, like the noted winter seasons the Sun is indeed exiting-the-dead of a solar minimum during 2020/21! Simply stated: strongly considering the noted factors there is greater than a 50% chance of above to well above normal snowfall and seasonal to slightly below normal temperatures in New England during the upcoming 2020/21 Winter Season. Forecaster: Daniel Viens, establishing author of New England NAO.                                                                                      


Wednesday, November 25, 2015

WINTER SEASON 2015/16: ENTERING SOLAR MINIMUM

The emerging sleep of-the-Sun, with only three (3) identified sunspots visible on the solar disk as of 
November 25, 2015.  
Originally prepared: November 23, 2015 (Facebook timeline-post) 
I would like to talk about El Niño, that has made significant headlines in the media. El Niño "The Boy", which is an unusual warming of Pacific sea surface temperature (SST) anomalies, is NOT basin wide through the equatorial Pacific Ocean. In fact close observation shows there is NO comparison to the 1997/98 super El Niño, as this particular event is *Central-to-West-based and NOT basin wide or East-based. This means the warming of SST anomalies over the Pacific is concentrated from the International Dateline, points east to the *Central / North American continent.
A *Central-to-West-based El Niño will in-fact encourage an energized sub-tropical jet-stream but ridging (above normal heights) over western North America due to the area of above normal SST's concentrated through the eastern Pacific, that will tend to encourage troughing (below normal heights) over eastern North America.
What is the foundation of the 2015/16 Winter season?
1. Solar Minimum / High Latitude Blocking - it's very important to consider that we are now entering a solar minimum following the 9-11 year sunspot cycle. The Sun has been averaging 20 daily events or less (in-terms of sunspot activity on the solar disk) since November 7, 2014, and is currently at 15 daily events as of November 20, 2015. Through the majority of absent New England Winter's of the 1990's, the Sun was averaging 40-100 daily events, * sending a moderate to high frequency of ultraviolet (UV) rays at-the-Earth. The higher frequency of ultraviolet (UV) rays acts to deplete ozone and in-return allows for pronounced cooling of the pole's stratosphere, with the Polar Vortex (PV) almost never splitting to influence middle latitudes of-the-Earth. Strongly taking into consideration current solar activity, lends hand to the highly cyclical 9-11 year (Schwabe) sunspot cycle, that we are indeed entering a solar minimum. The emerging sleep of-the-Sun will soon encourage pronounced warming of the pole's stratosphere due to increased ozone, * as this warming pushes down through the * stratosphere and troposphere, the PV will in-turn react and SPLIT, the pole will moderate. As the split PV drops south in-latitude, a reaction-to-action, ejecting the Arctic Oscillation (AO) North Atlantic Oscillation (NAO) into a pronounced negative phase. This will be the said driver of the 500-millibar Height Pattern over the Northern Hemisphere during the coming 2015/16 Winter season, NOT El Niño.
2. El Niño - the above said factors will tend to encourage an unusually stronger than normal or *enhanced* sub-tropical jet-stream, that will as-a-result of location, be a high moisture source to interact with the Polar jet-stream. This will be, an enhancer, encouraging a moderate to strong probability of Nor'easters.
When will this change influence New England?
While we have experienced a gradual step-down since mid November, there are key signals that will indicate CHANGE
A strong low pressure system tracking through the eastern Great Lakes region, producing rainfall in New England, around the week of November 29th may be the mechanism that encourages a significant pattern change. 
Therefore, December 5-12th is the time period of high volatility.
* Corrected information on sudden stratospheric warming & the current state of El Niño.

Wednesday, February 11, 2015

9-11 YEAR SUNSPOT CYCLE PROVES THREATENING FOR NEW ENGLAND NE!

Originally prepared: February 10, 2015 (Facebook timeline-post) 
The 2014/15 season is-the-true beginning of-a-cycle... supporting the RETURN OF classic OLD-FASHIONED-WINTER's in NEW ENGLAND! On January 14, 2015, I had posted that all-the-elements would (have the-potential-to) come together... with the return of the old fashioned New England winter, as experienced through most-of-the 1950's, 1960's, & 70's. As we realized the "cold", but had yet to observe a true snowstorm (Nor'easter). Since-that-post, Boston has recorded it's snowiest 7-day period in-history (during late January 2015), and Hartford, CT. is presently averaging around 8-10°F below normal for the month-of-February. While there are various forms of long range weather guidance, such as NOAA's CFS forecast model... nature itself has already provided us with strong clues. These clues rest with understanding of-the-Sun's 9-11 year sunspot cycle, known as the Schwabe Cycle, which averages to be exactly 10.66 years. Sunspots are temporary dark spots located on the photosphere of-the-Sun, that significantly reduces the temperature within the darkened spot, in-contrast to the outer surrounding of the solar disk. However, the influences go-far-beyond the solar disk through the release of ultraviolet (UV) rays. UV rays (due to highly active "charged" sunspots) fall back on-the-Earth, which has a direct poleward effect. The higher frequency of UV rays acts to "cool" the pole's stratosphere, as the Polar Vortex (PV) remains over-the-Arctic... thus NOT SPLITTING, dropping south, to influence middle latitudes of-the-Earth. During the period of a Solar Maximum, is when this activity peaks... the Winter of 2011/12 was a Solar Maximum. However, we are now heading toward a Solar Minimum (the five-year-period between a solar maximum), which allows for a reverse effect... due to virtually no sunspot activity on the solar disk. In return, the pole's stratosphere "warms", encouraging "Blocking High Pressure" in northern latitudes as the Polar Vortex (PV) SPLITS, becoming significantly displaced from the pole as it drops south in-latitude (*has occurred during this 2014/15 Winter season). Of extreme interest, the sun will truly enter a Solar Minimum around the 2015/16 Winter season, and have strong probability to-be-deep within a solar minimum during the 2016/17, 2017/18, 2018/19, 2019/20, & 2020/21 Winter seasons... following this highly cyclical cycle!


Saturday, January 24, 2015

FINAL THOUGHTS ON THE 2014/15 WINTER SEASON!

Originally prepared: January 14-15, 2015 (Facebook timeline-post) 
A further in-depth look at the 2014/15 Winter Season! Well, changes are... and certainly have occurred. The image below (although-not-current) depicts - MAJOR - changes that have occurred with the 500-millibar Height Pattern over North America (and the Northern Hemisphere as-a-whole). What has happened? The most noteworthy change from December is-with-the Polar Vortex (PV), itself. The polar vortex is an intense (cold) upper-level low pressure system that originates over the Arctic / North Pole, and this-is-where the PV stayed for most of December. However, through poleward stratospheric changes "warming"... the PV SPLIT into two (2) separate lobes and dropped south, with one lobe falling over North America, and the other over Eurasia. Through these changes, the pole moderates... as "Blocking High Pressure" becomes established across northern latitudes (i.e. Arctic Oscillation "AO" becomes increasingly negative), ejecting the upper-level low pressure system from the Gulf of Alaska & replacing-it with intensifying High Pressure (notice the greenish shade toward the Gulf of Alaska on-the-image, indicating moderating anomalies, which is a significant change from December). It's very IMPORTANT to understand that during most of-the-classic old fashioned winter's experienced in New England during the 1950's, 60's, & 70's the PV almost always split... if this doesn't take place, you end-up with a longwave weather pattern similar to-that-of December 2014, "progressive", which was experienced through most-of-the absent winter's of-the-1990's! Now that the PV has split, what will happen? The 500-millibar Height Pattern is-open to configure itself to repeat the 1950's, 60's, & 70's all-over-again... and will attempt to do just that on-or-about January 21st, before this time frame there will be a temporary moderation... indicating CHANGE. What does this mean? We have now certainly experienced the "cold" but have yet to combine that with true snowstorms (Nor'easters)... on-or-about this date (1/21) is when all-the-elements have the potential to-come-together (i.e. North Atlantic Oscillation "NAO" also becomes negative), thus "blocking" / lifting the jet-stream up along the U.S. Eastern seaboard, promoting East coast cyclogenesis. This change will make run at balancing the December blowtorch, as January 2015 should average "at least" 1-2° below normal in-temperature, however beyond this... with the exception of a brief mild spell around the second week-of-February, both February & March 2015 have a strong probability of averaging below normal in-temperature, considering the above-said-factors. In closing, the Winter Season of 2014/15 has strong potential of averaging slightly below normal in-temperature overall, with above normal snowfall through much-of-New England. What is average snowfall? For example: ADAMS / NORTH ADAMS - 78.1" average annual snowfall. Winter 2014/15: potential 100.0"+ for-the-season as-a-whole. BOSTON - around 43.0" average annual snowfall. Winter 2014/15: potential 50.0"+ for-the-season as-a-whole.


Monday, December 23, 2013

DECEMBER 23, 2013: WHERE IS THE NAO HEADED?

official product of... New England NAO

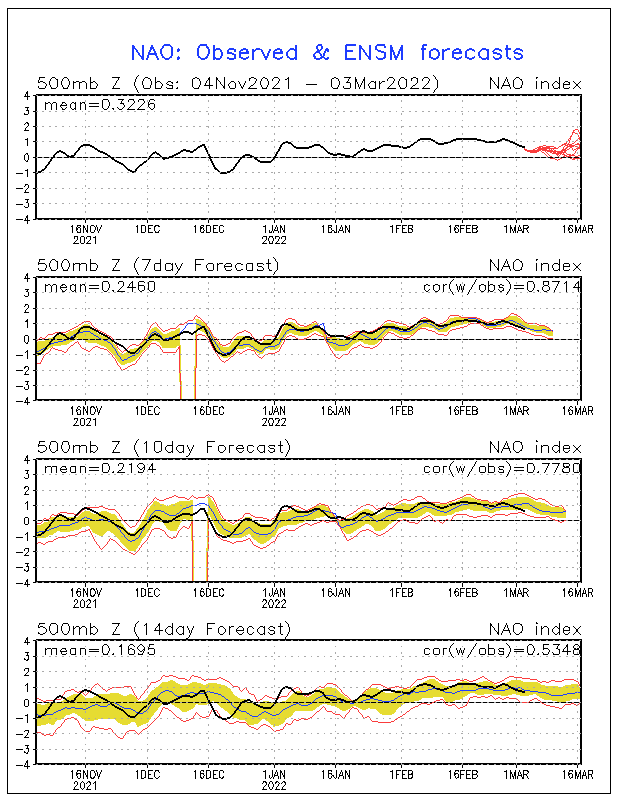
NAO GEFS Index Forecast - December 23, 2013

The North Atlantic Oscillation (NAO)
GFS MRF Ensemble Indice Forecast from
NOAA's Climate Prediction Center (CPC) is currently weakly Positive. The GFS Ensemble Indice Forecast indicates that the NAO will be very weakly Positive December 24-27. The Ensemble Indice Forecast indicates the NAO will be neutral to very weakly Negative December 28-31. The GEFS later indicates that the NAO will trend weakly Negative January 1-7. The NAO will then trend neutral to weakly Positive January 8-15.
The NAO Operational GFS Indice Forecast from CPC is also currently weakly PositiveThe GFS Indice Forecast indicates that the NAO will be very weakly Positive December 24-27. The Operational Indice Forecast indicates the NAO will be neutral to very weakly Negative December 28-31. The GFS later indicates that the NAO will trend weakly Negative January 1-7. The NAO will then trend neutral to weakly Positive January 8-15.  
NOTE: Indice Forecasts have been modified, due to Forecaster's understanding of the current Longwave pattern.


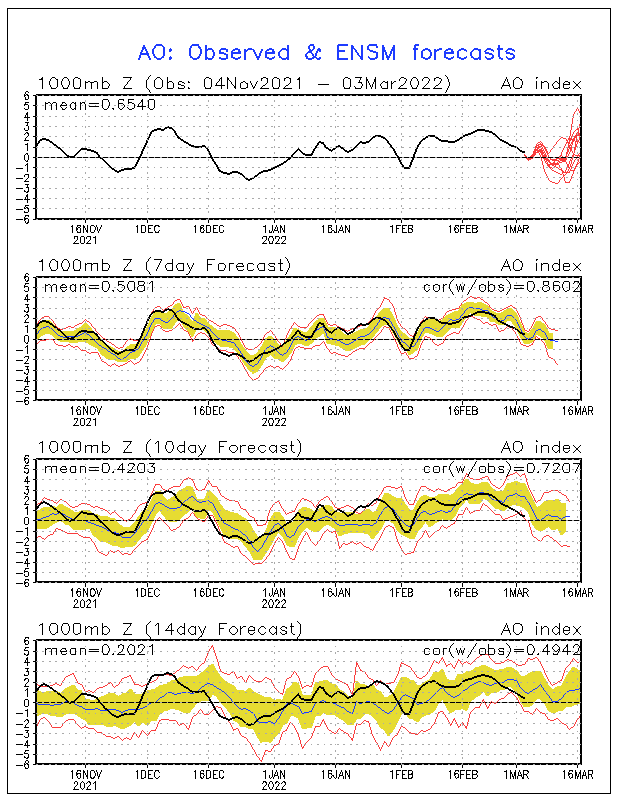
 AO GEFS Index Forecast - December 23, 2013
AO GEFS Index Forecast - December 23, 2013


The Arctic Oscillation (AO)
GFS MRF Ensemble Indice Forecast from CPC is currently moderately PositiveThe GFS Ensemble Indice Forecast indicates that the AO will be very weakly Positive December 24-27. The Ensemble Indice Forecast indicates the AO will be neutral to weakly Negative December 28-31. The GEFS later indicates that the AO will trend increasingly Negative January 1-7. The AO will then trend neutral to increasingly Positive January 8-15. 
The AO Operational GFS Indice Forecast from CPC is currently moderately Positive.  The GFS Indice Forecast indicates that the AO will be very weakly Positive December 24-27. The Operational Indice Forecast indicates the AO will be neutral to weakly Negative December 28-31. The GFS later indicates that the AO will trend increasingly Negative January 1-7. The AO will then trend neutral to increasingly Positive January 8-15. 
NOTE: Indice Forecasts have been modified, due to Forecaster's understanding of the current Longwave pattern.


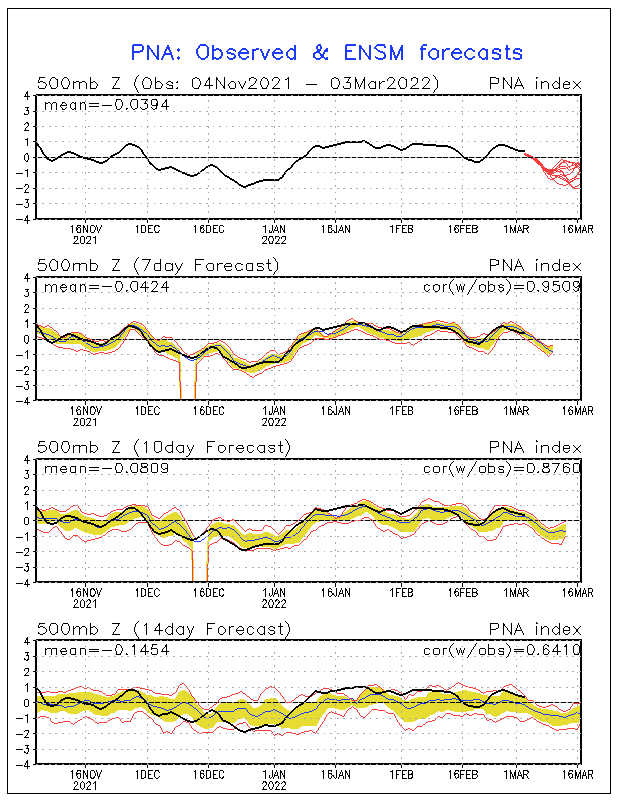
PNA GEFS Index Forecast - December 23, 2013


The Pacific-North American Oscillation (PNA)
GFS MRF Ensemble Indice Forecast from CPC is currently neutralThe GFS Ensemble Indice Forecast indicates that the PNA will be neutral to very weakly Positive December 24-27. The Ensemble Indice Forecast indicates the PNA will be weakly Positive December 28-31. The GEFS later indicates that the PNA will trend increasingly Positive January 1-7. The PNA will then trend neutral to weakly Negative January 8-15. 
The PNA Operational GFS Indice Forecast from CPC is currently neutralThe GFS Indice Forecast indicates that the PNA will be neutral to very weakly Positive December 24-27. The Operational Indice Forecast indicates the PNA will be weakly Positive December 28-31. The GFS later indicates that the PNA will trend increasingly Positive January 1-7. The PNA will then trend neutral to weakly Negative January 8-15. 
NOTE: Indice Forecasts have been modified, due to Forecaster's understanding of the current Longwave pattern.


The Eastern Pacific Oscillation (EPO)
GFS MRF Ensemble Indice Forecast from
NOAA's Earth System Research Laboratory (Physical Sciences Division) and NCEP, is currently weakly Negative. The GFS Ensemble Indice Forecast indicates that the EPO will be weakly Negative December 24-26. This indice forecast then indicates that the EPO will be increasingly Negative December 28-31. The GEFS later indicates that the EPO will trend weakly Negative January 1-6. The EPO will then trend neutral to weakly Positive January 7-13.

The Western Pacific Oscillation (WPO)
GFS MRF Ensemble Indice Forecast from NOAA's ESRL/PSD and NCEP, is currently moderately NegativeThe GFS Ensemble Indice Forecast indicates that the WPO will be moderately Negative December 24-26. This indice forecast then indicates that the WPO will be increasingly Negative December 28-31. The GEFS later indicates that the WPO will trend weakly Negative January 1-6. The WPO will then trend neutral to weakly Positive January 7-13. 


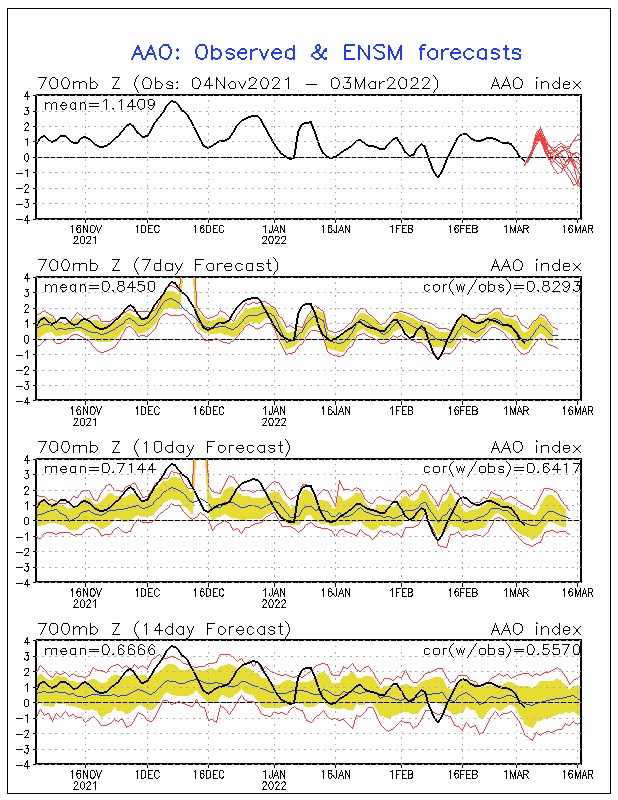
AAO GEFS Index Forecast - December 23, 2013


The Antarctic Oscillation (AAO)
GFS MRF Ensemble Indice Forecast from CPC is currently neutralThe GFS Ensemble Indice Forecast indicates that the AAO will be neutral December 24-27. The Ensemble Indice Forecast indicates the AAO will be neutral to weakly Negative December 28-31. The GEFS later indicates that the AAO will trend increasingly Negative January 1-7. The AAO will then trend neutral to increasingly Positive January 8-15.  
NOTE: Indice Forecasts have been modified, due to Forecaster's understanding of the current Longwave pattern.

Indice Forecasts are for Extended & Long Range Guidance only, and are not meant to be taken verbatim. Please consult NWS Albany, N. Y. / NWS Taunton, or the NWSFO covering your region... for official short-term regional zone forecasts.

EXTENDED OUTLOOK:
MERRY
CHRISTMAS!
Thoughts to keep-in-mind, the overall December "transition" discussed in the 
2013/14 Winter Outlook... is well-under-way. Established High Latitude Blocking episodes appear eminent as we enter January 2014!

Updated: January 2, 2014
WPO GEFS Index Forecast - January 2, 2014

WHAT CAUSED THE PAST WINTER BLAST!  

As discussed in the 2013/14 Winter Outlook, it was very clear that a resurgence in Solar Activity due to increased sunspots on the magnetically active solar disk in 
mid-to-late October... was responsible for the transition to an overwhelmingly 
Positive Phase of the Arctic Oscillation (AO) & 
North Atlantic Oscillation (NAO) from the beginning-of-November through most 
all-of-December. However, there was a real Winter blast for much-of-the first half of December that led to a coastal storm on Saturday, December 14, 2013. It is very important to note that while the AO & NAO did not favor such amplification of the 500-millibar Height Pattern, the 
Western Pacific Oscillation (WPO) above, and Eastern Pacific Oscillation (EPO) where predominantly Negative (circled-in-black above) from mid-to-late November through mid December. This meant that cold air was tapped and drawn southeast from North-central Canada, due to an expanding area of High pressure over the Gulf of Alaska. The WPO / EPO are highly influenced by the 
Pacific Decadal Oscillation (PDO)... which became slightly Positive during the Fall,  meaning that Pacific Sea Surface Temperature (SST) anomalies are warmer than normal, encouraging Blocking over the eastern Pacific. 
The -WPO / -EPO pattern collapsed due to lack-of-Teleconnection support in association to changes with the Madden Julian Oscillation (MJO)... as the enhanced area of tropical convection over the equatorial Pacific entered Phase 5-6, collapsing the ridge of High pressure over the eastern Pacific, which strongly encouraged the true effects of an overwhelmingly 
+AO / +NAO signature as New England experienced a classic blow-torch from December 20-23, 2013. Of interest, while the WPO & EPO where initially Positive from late October into the beginning of November... which was the peak-of-sunspot resurgence, the AO & NAO remained Positive beyond, due to extreme sensitivity to solar activity. The more active the sun, the more of a driver it is... influencing the Earth's stratosphere (poleward), where pronounced cooling occurs. Therefore, the orientation of the jet-stream keeps the heart of the Polar Vortex (PV) at the
North Pole...
encouraging an overall progressive pattern (with short-lived shots of cold air) in middle latitudes with a highly Positive Phase of the Arctic Oscillation (AO) and 
North Atlantic Oscillation (NAO).

PUNCH 1! BEGINNING OF CHANGE...
GFS 1000-500 hPa Thickness - January 2, 2014
Current 1000-500 hPa Thickness show a positively-tilt trough over the 
Mid-Atlantic, with a defined Polar Vortex (PV) (circled-in-white) over Quebec... marking the transition to a Negative Arctic Oscillation (AO). However, much of the southeastern United States... especially Florida, is experiencing above normal temperatures due to the North Atlantic Oscillation (NAO) only falling to around neutral. The neutral NAO allows for the southeast ridge to maintain it's identity, and in-return promotes a significant moderation for New England in-advance of Arctic fronts... due to a strong south-southwest flow in-advance of the frontal passage. This, for example, will occur on Monday, January, 6th. Aside from this, the period of January 3-10 will feature below to well below normal temperatures overall... with moderate-to-high potential of Miller Type B coastal storm development. This period will mark the true beginning of the Winter change, especially with the 
Arctic Oscillation (AO).


LONG RANGE THOUGHTS:

THE SUN & SOLAR CYCLE 24...
NASA Solar Activity as of January 2, 2014

While Solar Activity, in-terms of active sunspots, has lessened since November 2013... the extreme western quadrant of the sun remains active. Most of the solar disk, however, is becoming quiet or falling-to-sleep... which is important for sustained High Latitude Blocking episodes, and will be a significant factor in-the-years-to-come. It is very important to remember, on January 4, 2008 we entered Solar Cycle 24. While Solar Cycle 23 was highly active 
in-terms of sunspot activity, Solar Cycle 24 is trending much-less-active (as seen above)... especially since the actual observed Solar Maximum in 2011/12. Had this sunspot activity took place a decade ago, the out-come on the overall 500-millibar Height Pattern in the Northern Hemisphere... would have had a far greater impact. 
*A note to viewers, the Fall 2013 resurgence in sunspot activity should NOT be confused with the 
2011/12 Solar Maximum... as there is no comparison in the amount of UV Rays that hit the Earth now, in-contrast to then. Which is (in-part) why we will be experiencing the 
PUNCH-of-Winter!

MJO & BRIEF THAW... PATTERN RELOAD
MJO GEFS Forecast - January 2, 2014
The Madden Julian Oscillation (MJO) will emerge in Phase 6, from neutral over the western Pacific during the next 7-10 Days. This will play a role in temporarily shifting the ridge/trough axis over the eastern Pacific, encouraging a +WPO / +EPO  / -PNA influence, promoting the return to a +AO / +NAO Teleconnection January 11-18. During this period there will be a "January Thaw", temperatures will rise to above-to-much-above normal levels briefly along with increased risk of rainfall. This will be due to the shifting ridge/trough axis encouraging a southerly flow at all levels of the atmosphere in 
New England, as the AO & NAO return Positive.


PUNCH 2! COMPLETE TRANSITION...
NAO GFS Index Forecast - January 2, 2014
  The combined influence of significantly reduced sunspot activity... encouraging pronounced High Latitude Blocking as downward propagation of Poleward 
Sudden Stratospheric Warming (SSW) reacts, along with the continued forward propagating Phase 6-7 Madden Julian Oscillation (MJO) influence over the western Pacific, will reload the 500-millibar Height Pattern. This, however, will be a complete pattern transition... where a highly amplified -WPO / -EPO / +PNA Teleconnection, will drive a classic 
-AO / -NAO couplet over eastern North America as the Polar Vortex (PV) returns to east-central Canada around January 20-22. 


Prepared by: Daniel Viens


  New England NAO APP. - application available as a convenience to
Android Smartphone users on the Google Play Market.


What is the North Atlantic Oscillation?

Tuesday, November 19, 2013

THOUGHTS ON THE 2013/14 WINTER SEASON!

NASA Solar Activity as of November 19, 2013
 Solar Activity, while mentioned by few professionals concerning Winter Outlooks... is one-of-the most important factors shaping this upcoming Winter season, it is what I call the foundationThe above image of the solar disk from NASA on November 19, 2013, shows 4-active sunspot regions in-general (circled-in-black) on the sun. The sunspot region toward the center of the solar disk, is most active... however all circled sunspot regions have-to-be-watched. Of note, during a Solar Minimum, the solar disk would be virtually free of sunspot activity... as we head toward 2016, the above image will be less-of-a-factorSunspots have a direct relation to High Latitude Blocking episodes, due to the entrapment of heat through UV Rays... promoting increased ozone formation. The more active the sun, the more of a driver it is... influencing the Earth's stratosphere (poleward), where pronounced cooling occurs. Therefore, the orientation of the jet-stream keeps the heart of the Polar Vortex (PV) at the North Pole...
encouraging an overall progressive pattern (with short-lived shots of cold air) in middle latitudes with a highly Positive Phase of the Arctic Oscillation (AO) and 
North Atlantic Oscillation (NAO). As a result, the weather pattern experienced in middle latitudes, is an overall milder, dryer pattern... which is a signature of increased solar activity, especially during a Solar Maximum.

AO GEFS Index Forecast  -  November 19, 2013
Looking at the Arctic Oscillation (AO) Global Ensemble Forecast System (GEFS) forecast, shows true signs of solar influence. Within the area circled-in-red, the AO Index has been averaging around  +3.0 Standard Deviation (SD) above normal-mean... from extreme late October to mid-November. During this time period there was also a  pronounced resurgence in sunspot activity, which is clearly observed with this classic +AO signature.

SWPC Solar Cycle Progression as of November 4, 2013
Viewers of this site understood that a Solar Maximum was experienced during 2011/12 & 2001/02... following the 9-11 year Schwabe Cycle, which averages to be exactly every 10.66 years that a solar maximum is observed. However, following this cycle also hints at a resurgence of solar activity about 2 years after the actual observed maximum... this occurred in 2003/04 (which highly influenced that Winter season) now were 2 years after the maximum again, with another resurgence in sunspot activity. In posts I published during the 2012/13 Winter Season, I wrote about a return to the classic old-fashioned New England Winter's (as experienced throughout most of the 1960's & 70's) from 2016 through 2020. I stated this with a strong understanding that this period will be the start of a Solar Minimum (which will strongly encourage High Latitude Blocking episodes due to a non-active solar influence), following the Schwabe Cycle. But, there is also another important factor to strongly consider...
on January 4, 2008 we entered Solar Cycle 24. While Solar Cycle 23 was highly active in-terms of sunspot activity, especially before the observed minimum in 2006 (as seen on the SWPC image above), Solar Cycle 24 has paled in-comparison. This is a highly important factor, that will also have a significant influence over the next decade+... considering that the actual solar cycle is about 22 years long.

My thoughts for the 2013/14 Winter Season: Due to a resurgence in solar activity, it's critical in how active the sun remains. However, I will clearly state that seeing the actual Solar Maximum was observed in 2011/12... I certainly believe that it won't be as mild as that Winter. In fact, if you follow the Schwabe Cycle closely... this resurgence in active sunspots should be short-lived. Taking this strongly into consideration, I feel the potential is strong for established High Latitude Blocking episodes from January through March. December is critical, but will more than likely be a period of transition... as the current solar activity will be less of a factor on the overall 500-millibar Height Pattern.

Now that I presented the foundation, I am going to link to NY NJ PA Weather for the finer details on the Winter Forecast for 2013/2014... which is the best seasonal outlook I have ever read.

New England NAO will continue to-be-updated through the Winter season.